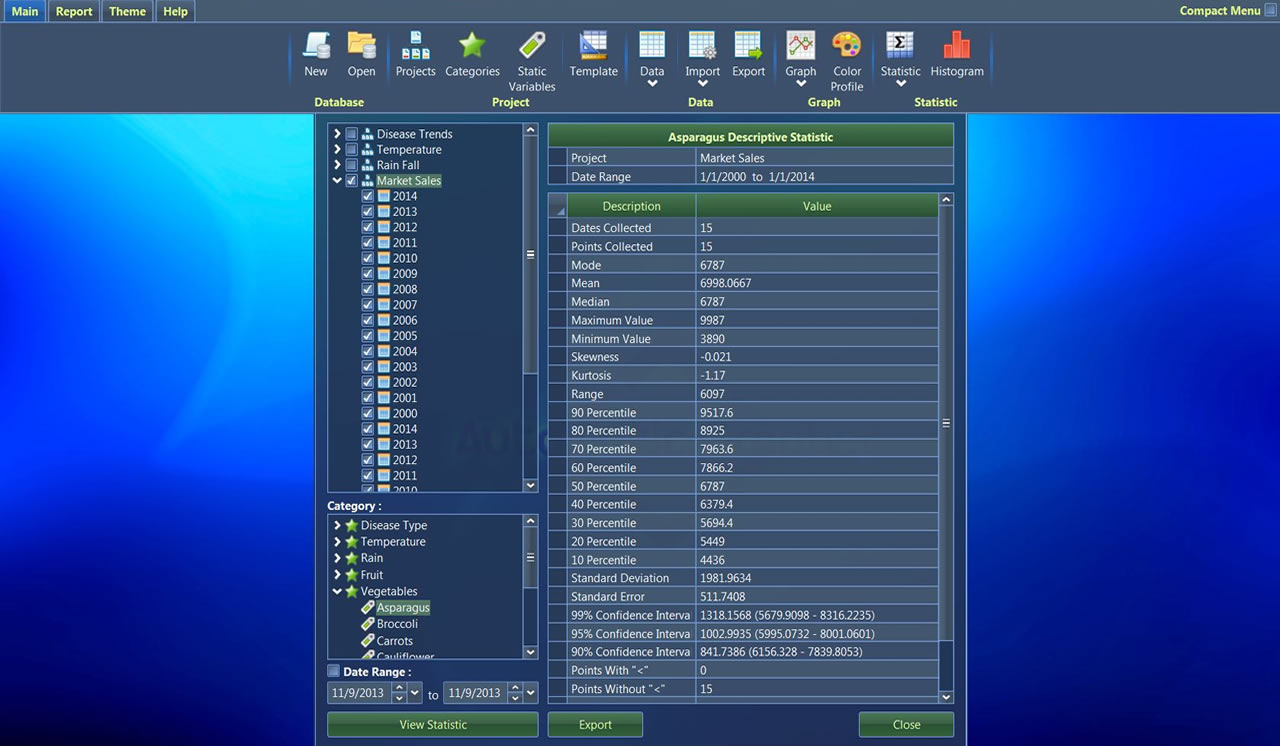
Instantly calculate all these statistics on any dataset
Descriptive Statistics Tools |
|
|---|---|
| Dates Collected | The number of dates collected. |
| Number of points collected | Number of values collected. |
| Mode | The mode is the most frequently occurring value. |
| Mean | The sum of the values divided by the total amount of numbers. |
| Median | The median is the number in the middle of a dataset. |
| Max Value | Largest value in data set. |
| Min Value | Smallest Value in data set. |
| Skewness | Characterizes the degree of asymmetry of a distribution around its mean. |
| Kurtosis | Relative peakedness or flatness of a distribution. |
| Range | Difference between largest and smallest number. |
| 90 percentile | Number where 90% of the values fall below. |
| 80 Percentile | Number where 80% of the values fall below. |
| 70 Percentile | Number where 70% of the values fall below. |
| 60 Percentile | Number where 60% of the values fall below. |
| 50 Percentile | Number where 50% of the values fall below. |
| 40 Percentile | Number where 40% of the values fall below. |
| 30 Percentile | Number where 30% of the values fall below. |
| 20 Percentile | Number where 20% of the values fall below. |
| Standard Error | This is the standard deviation divided by the square root of the sample size. |
| Standard Deviation | Shows the variation from the mean. |
| 99% Confidence Interval | From the data collected there is a 99% chance the true mean lies between the numbers. |
| 95% confidence Interval | From the data collected there is a 95% chance the true mean lies between the numbers. |
| 90% Confidence Interval | From the data collected there is a 90% chance the true mean lies between the numbers. |
| # of Detects | List the number of non-detects values. |
| # of Non Detects | Counts the number of non-detects. |
| Detection Limit minimum | Lowest detection limit. |
| Detection Limit maximum | Highest detection limit. |
