Import your data and instantly generate graphs to individually numbered JPG’s, a word document or a PDF file!
The reports section can be used to instantly generate daily, monthly, yearly or complete time frame graphs. Click the Project and Category to generate all the graphs in the database for those sections. The graphs can be viewed on the screen and saved as image files, a word document or pdf file. The reports section will automate the graphing process and save time compared to updating Excel spreadsheets.
Daily reports can be used to graph data collected each day. If your dataset includes minute and hourly values, the daily report section can generate a separate graph for each day. Choose from 5 different types of graphs.
Monthly reports can be used to graph data collected each month. A new graph for each month will be generated for the time frame selected. Choose from 5 different types of graphs.
Yearly reports can be used to graph data collected each year. A new graph for each year will be generated for the time frame selected. Choose from 5 different types of graphs.
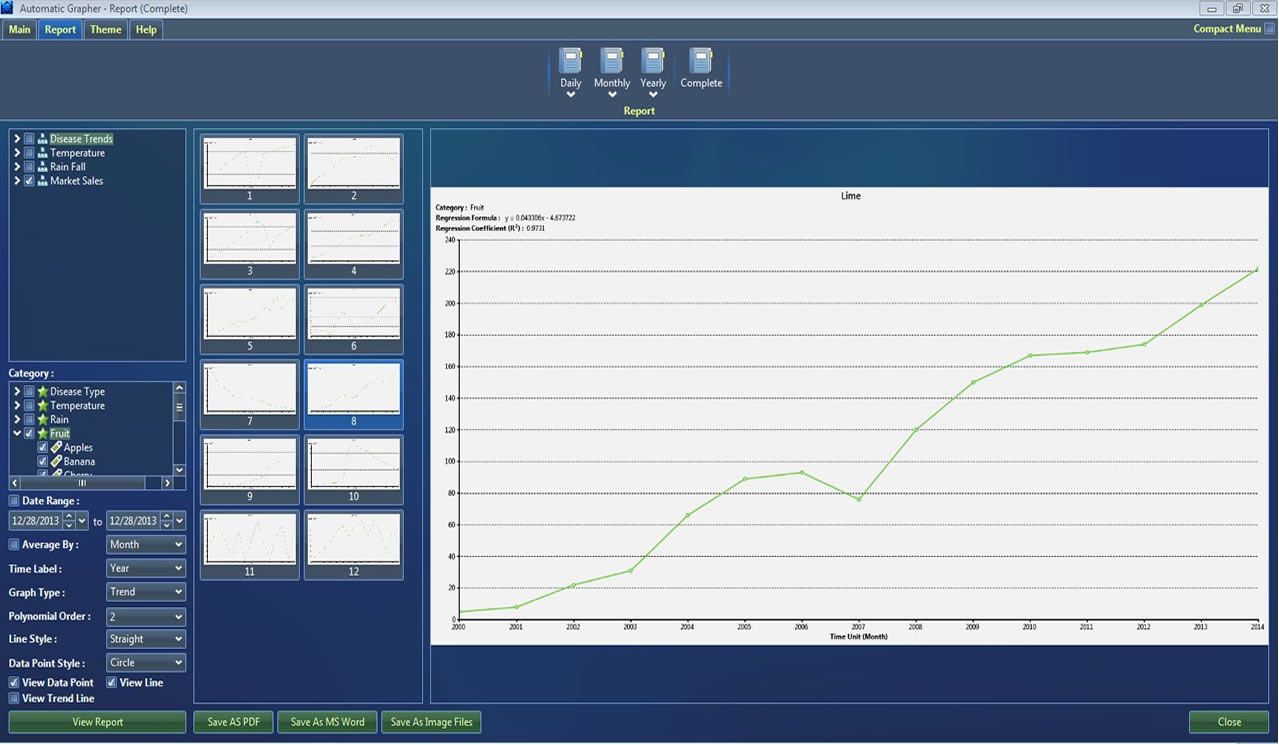
The complete reports section can be used to generate graphs for the entire time frame of any category in the database. Choose multiple projects and categories. This section will generate all of the data in the database instantly display on the screen. Export the graphs as a batch of jpg’s, compiled in a word document or a pdf file.