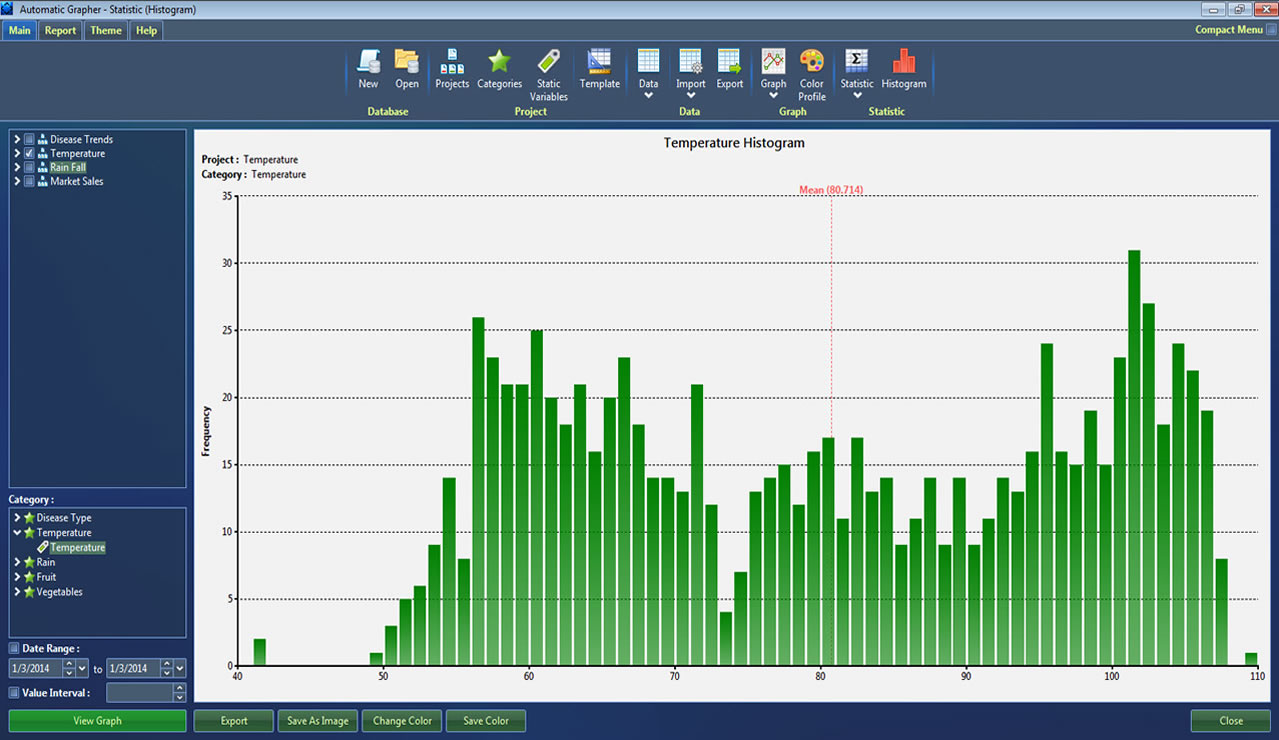
Histogram Statistics
Generate histograms with your dataset
- Plot the frequency of values around the mean.
- Understand the distribution of data.
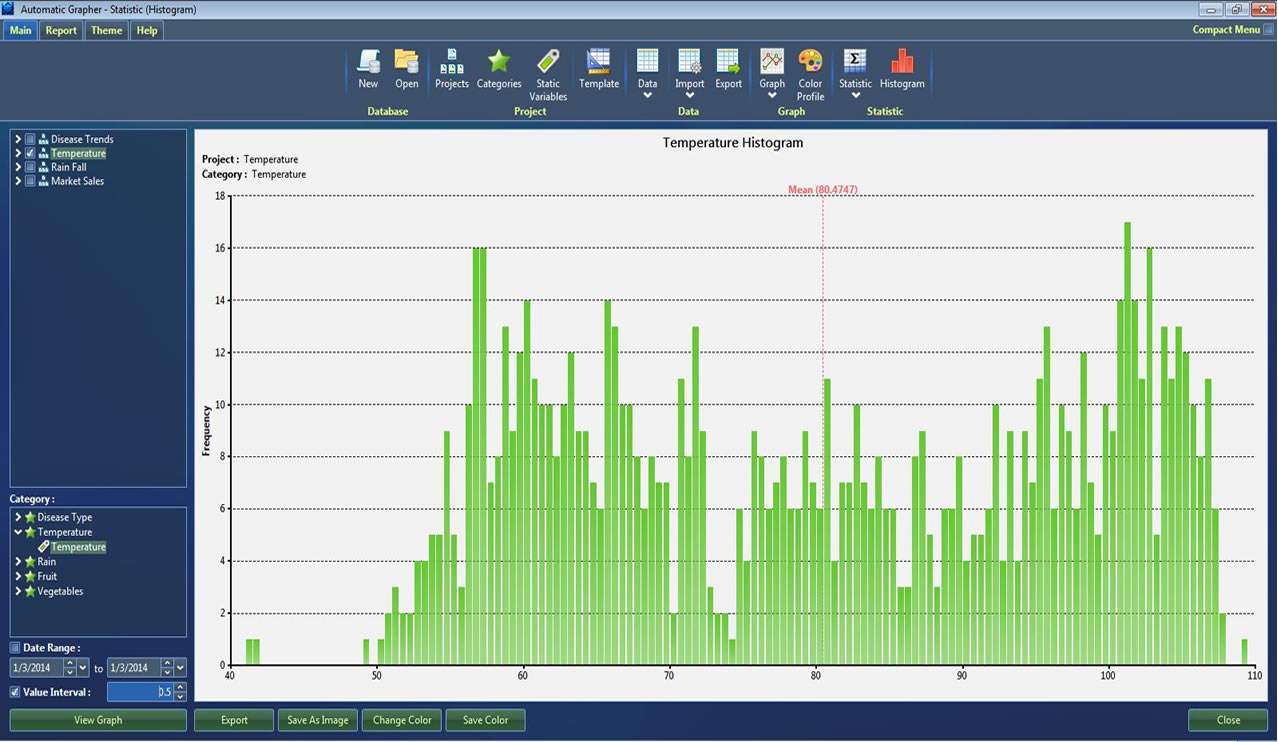
- Change the value interval.
- Modify the colors.
- Identify outliers or trends.
- Export plot for presentations and reports.
- Export data and graphs into an Excel file.
All Rights Reserved 2014 Automatic Grapher